context
The goal was to simplify how users monitor financial data by presenting complex information in a clear and structured format.
context
The goal was to simplify how users monitor financial data by presenting complex information in a clear and structured format.
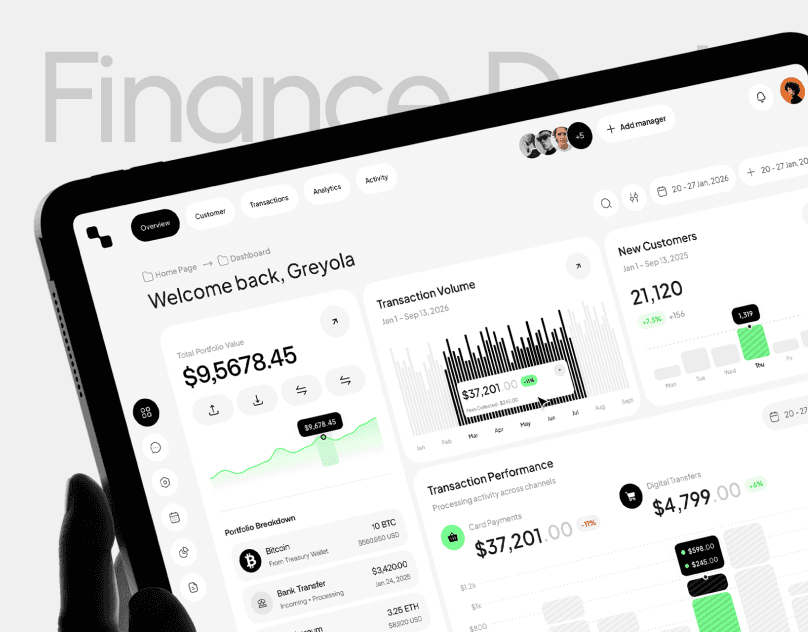
This project focuses on designing a fintech dashboard that enables users to track portfolio value, transaction activity, and customer insights in a single interface.
This project focuses on designing a fintech dashboard that enables users to track portfolio value, transaction activity, and customer insights in a single interface.
The interface prioritizes clarity, allowing users to quickly understand financial metrics without being overwhelmed by data.
This project focuses on designing a fintech dashboard that enables users to track portfolio value, transaction activity, and customer insights in a single interface.
The interface prioritizes clarity, allowing users to quickly understand financial metrics without being overwhelmed by data.
The Challenge
Presenting large volumes of financial data without creating confusion or visual overload.
Financial dashboards often contain dense information, making it difficult for users to identify key insights quickly.
Financial dashboards often contain dense information, making it difficult for users to identify key insights quickly.
The challenge was to organize data in a way that is both informative and easy to scan.
The Challenge
Presenting large volumes of financial data without creating confusion or visual overload.
Financial dashboards often contain dense information, making it difficult for users to identify key insights quickly.
The challenge was to organize data in a way that is both informative and easy to scan.
The Problem
Users struggle to interpret complex financial data when it is poorly structured or visually cluttered.
Important metrics such as portfolio value, transaction volume, and customer growth are often buried within dense layouts.
Important metrics such as portfolio value, transaction volume, and customer growth are often buried within dense layouts.
This reduces usability and makes decision-making slower and less efficient.
The Problem
Users struggle to interpret complex financial data when it is poorly structured or visually cluttered.
Important metrics such as portfolio value, transaction volume, and customer growth are often buried within dense layouts.
This reduces usability and makes decision-making slower and less efficient.
The Solution
A structured dashboard layout that highlights key metrics while maintaining visual clarity.
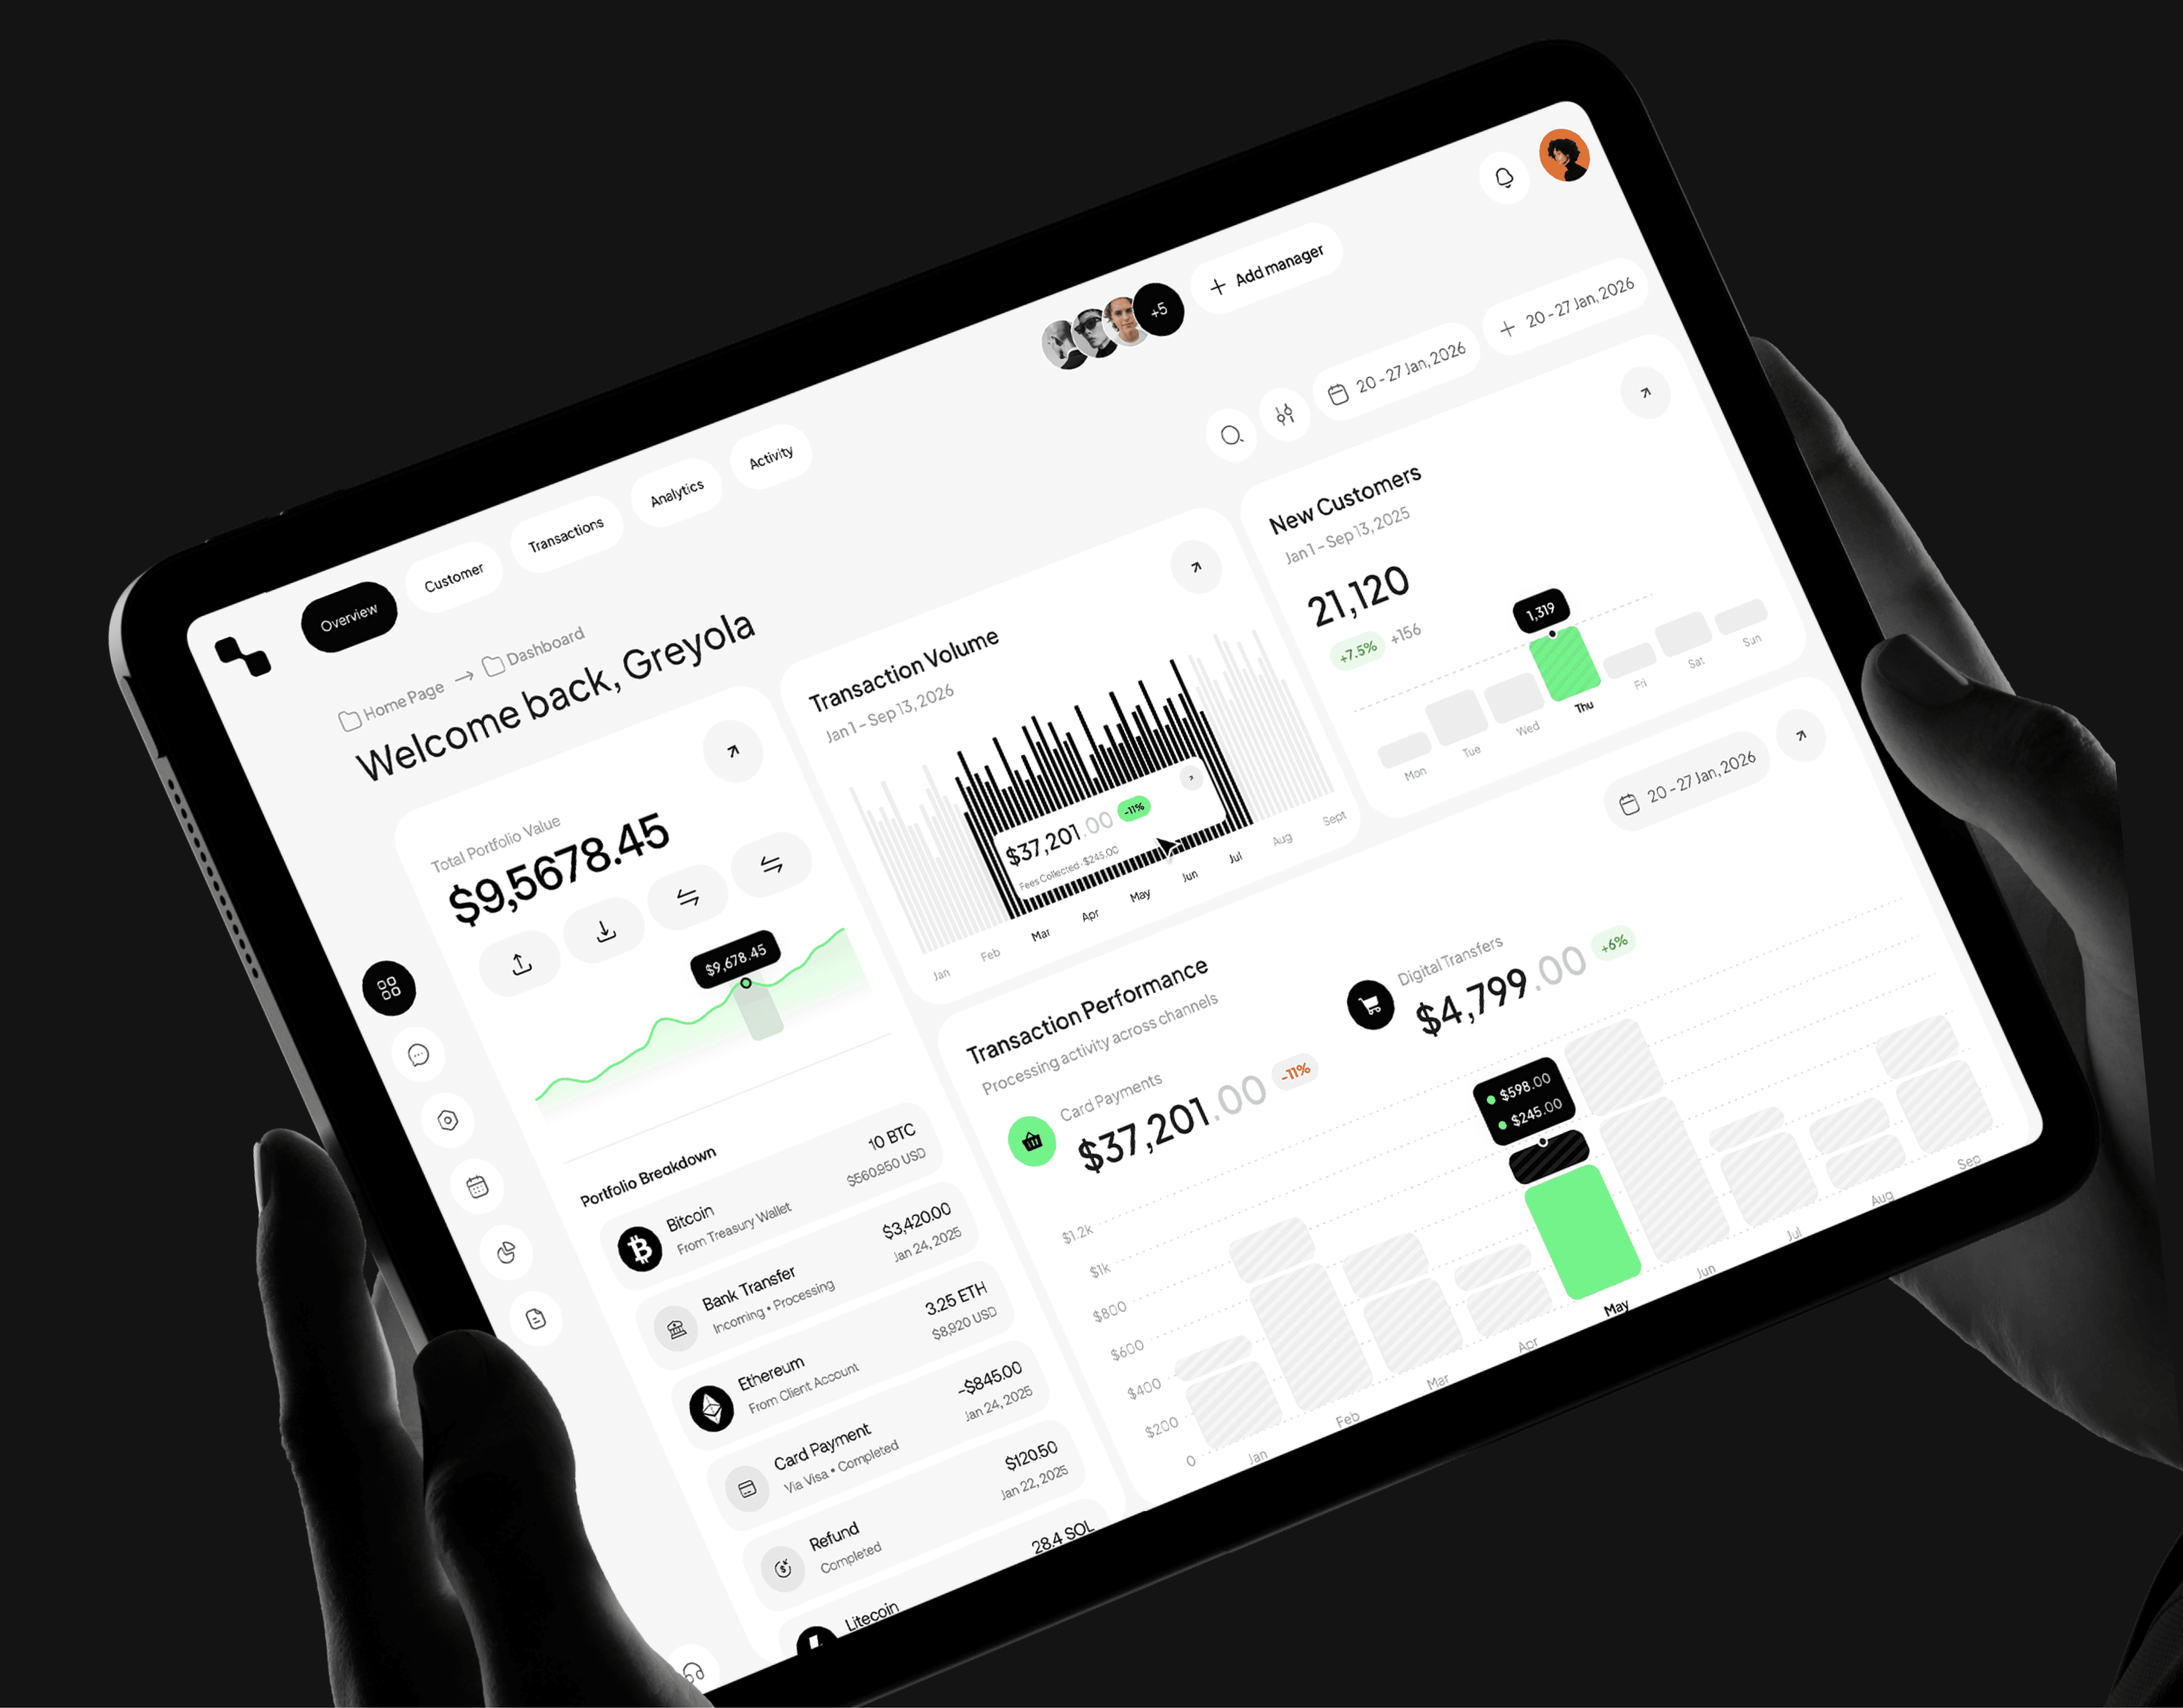
The dashboard is designed using modular components that separate data into clear sections such as portfolio overview, transactions, and performance analytics.
The dashboard is designed using modular components that separate data into clear sections such as portfolio overview, transactions, and performance analytics.
Visual hierarchy and spacing ensure users can scan and interpret information quickly.
The Solution
A structured dashboard layout that highlights key metrics while maintaining visual clarity.
The dashboard is designed using modular components that separate data into clear sections such as portfolio overview, transactions, and performance analytics.
Visual hierarchy and spacing ensure users can scan and interpret information quickly.

Design Approach
A minimal and structured design system ensures clarity across all data-heavy components.
The interface uses a clean layout with clear typography, subtle color usage, and consistent spacing to improve readability.
The interface uses a clean layout with clear typography, subtle color usage, and consistent spacing to improve readability.
Charts, cards, and data points are organized to guide user attention toward the most important information.
Design Approach
A minimal and structured design system ensures clarity across all data-heavy components.
The interface uses a clean layout with clear typography, subtle color usage, and consistent spacing to improve readability.
Charts, cards, and data points are organized to guide user attention toward the most important information.

Key Features
Core functionalities designed to simplify financial tracking and improve usability.
The dashboard integrates multiple financial insights into a unified and easy-to-use interface:
• Real-time portfolio tracking
• Transaction volume and performance analytics
• Customer growth and activity insights
• Notification and messaging system
• Clean and modular dashboard layout

conclusion
Users can monitor portfolio performance, track transactions, and review customer activity from a single dashboard. The experience is designed to feel structured, efficient, and easy to navigate.
conclusion
Users can monitor portfolio performance, track transactions, and review customer activity from a single dashboard. The experience is designed to feel structured, efficient, and easy to navigate.
Want to explore the full
case study?
Want to explore the full
case study?
View the complete breakdown, visuals, and design process on Behance.